From XKCD:


From XKCD:
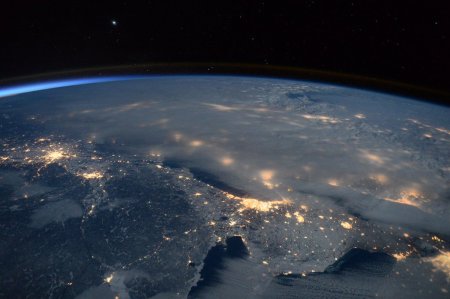
Astronaut Scott Kelly posted some AWESOME pics of the blizzard Jonas from the ISS. Enjoy!
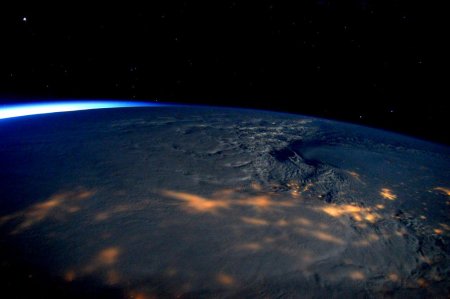
Snow storm blanketing the East Coast
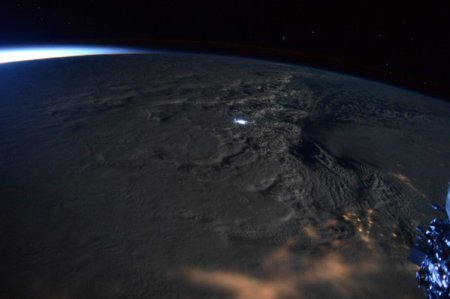
Thunder snow!
For all you weather aficionados, weather.com is providing the full synopsis on winter storm Jonas. As someone stuck in in DC during the storm, it truly was an epic blizzard!!


Winter Storm Jonas produced prolific amounts of snow in parts of the East, rivaling infamous snowstorms of the recent past. Snowfall totals from the storm topped out near 42 inches in West Virginia and at least 14 states in total received more than a foot of snow from the storm.
Below is a look at Jonas’ ranking in history among some of the biggest storms on record, topping the Blizzard of 1996 or the February 2003 President’s Day II storm in some cases. You will also find a full recap of snow, wind and coastal flooding reports by state.
Where Jonas Was the All-Time Heaviest Snowstorm
Jonas was the single biggest snowstorm on record for at least six locations in the East:
- Allentown, Pennsylvania: 31.9 inches Jan. 22-23, 2016 crushed the Jan. 7-9, 1996 blizzard total of 25.9 inches.
- Baltimore-Washington International Airport, Maryland (BWI): 29.2 inches Jan 22-23, 2016 beat the President’s Day II storm of Feb. 16-18, 2003. Records date back to 1892.
- Harrisburg, Pennsylvania: 30.2 inches Jan. 22-23, 2016 tops 25 inches Feb. 11-12, 1983. Records date back to 1888.
- New York – LaGuardia Airport: 27.9 inches Jan. 23, 2016 beats the previous record snowstorm of 25.4 inches Feb. 11-12, 2006. Records date back to 1945.
- New York – JFK Airport: 30.5 inches Jan. 23, 2016 beats the previous record snowstorm of 26 inches in the President’s Day II storm of Feb. 16-18, 2003.
- Newark, New Jersey: 27.9 inches Jan. 22-23, 2016 surpassed the Jan. 7-8, 1996 blizzard total of 27.8 inches. Records date back to 1893.
Jonas also ranked high among the biggest snowstorms on record in the following locations, but fell short of the record.
- New York City’s Central Park: Jonas dumped 26.8 inches of snow on Central Park where records date back to 1869. This was just shy of the record snowstorm of 26.9 inches set Feb. 11-12, 2006.
- Washington, D.C.: The storm total of 17.8 inches at Reagan-National Airport tied Feb. 5-6, 2010 as the fourth heaviest snowstorm dating to 1884.
- Philadelphia: A storm total of 22.4 inches was recorded in Jonas, ranking as the fourth heaviest snowstorm. This is also equal to the amount of snow Phildelphia averages during the course of an entire season.
Most Extreme Snowfall Totals By State
At least six states saw more than 2 feet of snow and 14 states reported more than a foot of snow from Jonas. Here are some of the most extreme snowfall totals from Jonas by state.
Mid-Atlantic and Northeast (Jan. 22-24, 2016)
- West Virginia: 42 inches of snow in Glengary, in the eastern panhandle of West Virginia.
- Virginia: 39 inches in Philomont, about 25 miles northwest of Washington, D.C.
- Maryland: 38 inches in Redhouse, in western Maryland. Redhouse is 150 miles west of Baltimore.
- New York: 31.3 inches in Port Richmond.
- Pennsylvania: 38.3 inches near Greencastle.
- New Jersey: 33 inches in Morris Plains.
- Connecticut: 16 inches in Norwalk.
- Delaware: 17.2 inches in Woodside.
- Rhode Island: 15.5 inches at Westerly, in the southwestern corner of the state.
- Massachusetts: 15.5 inches at West Harwich on Cape Cod. Blizzard conditions verified in Chatham, Nantucket, Martha’s Vineyard and Plymouth.
South and Ohio Valley (Friday-Early Saturday)
- Kentucky: 22 inches near Booneville in eastern Kentucky; 12.2 inches of snow and 0.30 inch of ice in Bowling Green; 2 inch per hour snowfall rates in Jackson with a storm total of 16.2 inches
- North Carolina: 19 inches near Old Fort. Also 0.65 inches of ice glaze near Selma.
- Ohio: 17 inches in Graysville, in southeast Ohio, about 80 miles southwest of Pittsburgh.
- Tennessee: 14 inches in Jamestown. Nashville reported thundersnow during the day Friday with a storm total of 8 inches.
- Arkansas: 8 inches near Sherwood, Cabot and Jacksonville.
- Georgia: 7.5 inches at Dillard in Rabun County of far northeast Georgia.
- South Carolina: 7.5 inches of snow in Inman; 1/2 inch of ice glaze in Fort Mill. Both are close to the North Carolina border.
- Illinois: 5.5 inches at Shawneetown, in the southeastern parts of the state near the Ohio River.
- Indiana: 5 inches in Floyds Knobs, just over the Ohio River from Louisville.
- Alabama: 3.5 inches near Harvest, just to the northwest of Huntsville.
- Louisiana: 2.5 inches in Haynesville, near the Arkansas border.
- Mississippi: 2 inches in Oxford and Myrtle, both in northern Mississippi.
During the early stages of Jonas’ development, snow fell in the Plains states Thursday. Snowfall totals included:
- Kansas: 10 inches in Barnes; 9.5 inches in Haddam
- Nebraska: 9 inches in Hebron; 8 inches in Hubbell
- Missouri: 3 inches snow in East Prairie
High Winds
Very high winds developed over the Mid-Atlantic, just north of the low pressure center associated with Winter Storm Jonas, later expanding into parts of southeastern New England.
Some of the highest reported wind gusts include:
- 85 mph on Assateague Island in Maryland (4:40 a.m. Saturday)
- 75 mph Dewey Beach, Delaware (7:35 a.m. Saturday)
- 75 mph at Langley Air Force Base near Newport News, Virginia (12:43 a.m. Saturday)
- 73 mph at Siasconsett, Massachusetts on Nantucket Island (2:47 p.m. Saturday)
- 73 mph in Lewes, Delaware (6:18 a.m. Saturday)
- 72 mph at Good Luck Point, New Jersey (6:49 a.m. Saturday)
- 71 mph in Poquoson, Virginia (1 a.m. Saturday)
- 70 mph at Marshfield, Massachusetts (4:55 p.m. Saturday)
- 70 mph at Wallops Island, Virginia (4:32 a.m. Saturday)
- 69 mph at Cape Henry in Virginia Beach, Virginia (12:12 a.m. Saturday)
- 68 mph at Tuckerton, New Jersey (6:47 a.m. Saturday)
- 66 mph in Georgetown, Delaware (4:40 a.m. Saturday)
Top sustained winds include:
- 57 mph at Assateague Island, Maryland (4:40 a.m. Saturday)
- 56 mph just offshore at the Chesapeake Light buoy east of Virginia Beach, Virginia (12 a.m. Saturday)
- 59 mph in Lewes, Delaware (6:24 a.m. Saturday)
- 55 mph at Cape Henry in Virginia Beach, Virginia (12:12 a.m. Saturday)
- 55 mph at the Brandywine Light buoy in lower Delaware Bay (5:00 a.m. Saturday)
- 53 mph at Wallops Island, Virginia (4:36 a.m. Saturday)
Coastal Flooding
On Saturday morning, the water level at Lewes, Delaware, rose to 9.27 feet, due to a storm surge of more than 4 feet above normal astronomical tides. This is the highest level on record at that location, beating 9.20 feet during the infamous Ash Wednesday nor’easter on March 6, 1962. Record flooding has also been observed in at least three New Jersey locations (Great Channel at Stone Harbor, Cape May Harbor, Delaware Bay at Cape May). Major impacts were reported from the flooding from southern New Jersey into Delaware.
NBC News reports on the developing Hurricane Patricia, which is now the strongest hurricane ever recorded and is on a path to hit Mexico. Other meteorologists commented on the super storm on social media, including fan favorite Jim Cantore who took a somewhat dramatic tone (tweets above and below).
[tweet https://twitter.com/JimCantore/status/657483877380935680]Hurricane Patricia became the strongest storm ever measured on the planet early Friday, with experts warning it could trigger 40-foot waves along Mexico’s coast and “life-threatening” flash flooding.
Several million residents were told to prepare for the “worst-case scenario” as Patricia was expected to race ashore on Mexico’s Pacific coast late Friday afternoon or early evening. The tourist magnets of Puerto Vallarta and Manzanillo were directly in the Category 5 storm’s projected path.
Featuring 200 mph winds, the U.S. National Hurricane Center described Patricia the “strongest hurricane on record” in the Atlantic and eastern North Pacific Basins.
What did climate scientists warn us would be a consequence of climate change? Unprecedented extreme weather including deadly hurricanes??…. Right, that one. Climate change is real, and we are seeing the consequences NOW. We need to take drastic measures to try to curb climate change or more storms like this and worse are in our near future. Tell our world leaders that climate change needs to be a priority before the Paris Climate Summit – https://www.climaterealityproject.org
[tweet https://twitter.com/CauseScience1/status/657536569780379649]
Check out this cool animation/video of Tropical Storm Bill is running into Texas, courtesy of NASA!!
This movie of GOES-East satellite imagery shows Tropical Storm Bill developing on June 14 and 15 to its landfall along the southeastern Texas coast on June 16. Credit: NASA/NOAA GOES Project
This weather is giving some Wizard of Oz realness!
Around 2:00pm MDT supercells began developing in a band across beginning in central Colorado and extending eastward into eastern Colorado by around 4pm. A cell near Lamar, CO became tornadic ~4:30pm MDT and produced a photogenic elephant trunk tornado with rainbow in foreground near Eads, CO. The storm later produced several times before crossing the cold front north of Cheyenne Wells, CO. Several tornadoes were also intercepted after dark in western KS near Oakley around 9pm CDT.
Senator James Inhofe seems completely crazy in this clip confusing weather and climate change. He seems to claim that climate change doesnt exist… ’cause snowball. It turns out that a lot of ignorant people make this same mistake, or just choose to ignore science and definitions. Examples here and here.
By Jennifer Francis, Rutgers University
Everyone loves to talk about the weather, and this winter Mother Nature has served up a feast to chew on. Few parts of the US have been spared her wrath.
Severe drought and abnormally warm conditions continue in the west, with the first-ever rain-free January in San Francisco; bitter cold hangs tough over the upper Midwest and Northeast; and New England is being buried by a seemingly endless string of snowy nor’easters.
Yes, droughts, cold and snowstorms have happened before, but the persistence of this pattern over North America is starting to raise eyebrows. Is climate change at work here?
One thing we do know is that the polar jet stream – a fast river of wind up where jets fly that circumnavigates the northern hemisphere – has been doing some odd things in recent years.
Rather than circling in a relatively straight path, the jet stream has meandered more in north-south waves. In the west, it’s been bulging northward, arguably since December 2013 – a pattern dubbed the “Ridiculously Resilient Ridge” by meteorologists. In the east, we’ve seen its southern-dipping counterpart, which I call the “Terribly Tenacious Trough.” (See picture, below.)

NOAA
These long-lived shifts from the polar jet stream’s typical pattern have been responsible for some wicked weather this winter, with cold Arctic winds blasting everywhere from the Windy City to the Big Apple for weeks at a time.
We know that climate change is increasing the odds of extreme weather such as heatwaves, droughts and unusually heavy precipitation events, but is it making these sticky jet-stream patterns more likely, too? Maybe.
The jet stream is a dastardly complex creature, and figuring out what makes it tick has challenged atmospheric scientists since it was discovered about 75 years ago. Even more elusive is figuring out how climate change will affect it.
Jet streams exist because of differences in air temperature. In the case of the polar jet stream, which is responsible for most of the weather we experience around the middle-latitudes of the northern hemisphere, it’s the cold Arctic butting against warmer areas to the south that drives it. (A more in-depth explanation can be found here.) Anything that affects that temperature difference will affect the jet stream.

This is where climate change comes in: the Arctic is warming much faster than elsewhere. That Arctic/mid-latitude temperature difference, consequently, is getting smaller. And the smaller differential in temperatures is causing the west-to-east winds in the jet to weaken.
Strong jets tend to blow straight west to east; weaker jets tend to wander more in a drunken north/south path, increasing the likelihood of wavy patterns like the one we’ve seen almost non-stop since last winter.
When the jet stream’s waves grow larger, they tend to move eastward more slowly, which means the weather they generate also moves more slowly, creating more persistent weather patterns.
At least, that’s the theory. Proving it is not easy because other changes are happening in the climate system simultaneously. Some are natural fluctuations, such as El Niño, and others are related to increasing greenhouse gases.
We do know, however, that the Arctic is changing in a wholesale way and at a pace that makes even Arctic scientists queasy. Take sea ice, for example. In only 30 years, its volume has declined by about 60%, which is causing ripple effects throughout the ocean, atmosphere, and ecosystem, both within the Arctic and beyond. I’ve been studying the Arctic atmosphere and sea ice my entire career and I never imagined I’d see the region change so much and so fast.
To study the effects of Arctic change on weather patterns, we have good measurements of atmospheric temperatures and winds going back to the late 1970s, when satellites started providing data, and pretty good measurements back to the late 1940s.
My colleagues and I have been using this information to measure the waviness of the jet stream and whether it is behaving differently since the Arctic started its rapid warm-up about 20 years ago. Because the upper atmosphere is such a cacophony of swirling winds, however, measuring changes in the jet stream’s waviness is tricky, as it’s not a metric that scientists have traditionally used.
Our challenge, then, is to find new methods to measure waviness and determine whether any changes we find are related to rapid Arctic warming, to some other change in the climate system, or to just random chance. While the story is still in early days, the plot is thickening.
Several groups around the globe, including my colleagues and me, are trying to understand the linkages between rapid Arctic warming and changes in weather patterns.
A number of recent studies have found what appears to be a solid connection between sea-ice loss in an area north of western Russia during the fall and a rash of abnormally cold winters in central Asia. The loss of sea ice favors a northward bulge in the jet stream, which strengthens surface high pressure to the east. That shift pumps cold Arctic air southward into central Asia.
Other studies suggest that Arctic warming in summer leads to a split jet stream – or two separated rivers of wind – which tends to trap the waves. Those stationary waves cause weather conditions to remain “stuck” for long periods, increasing the likelihood of extreme heat waves, droughts and flooding events in Eurasia and North America.
Our own new work, published last month in Environmental Research Letters, uses a variety of new metrics to show that the jet stream is becoming wavier and that rapid Arctic warming is playing a role. If these results are confirmed, then we’ll see our weather patterns become more persistent.
In other words, Ridiculously Resilient Ridges and Terribly Tenacious Troughs may become the norm, along with the weather woes they cause.
![]()
This article was originally published on The Conversation.
Read the original article.


